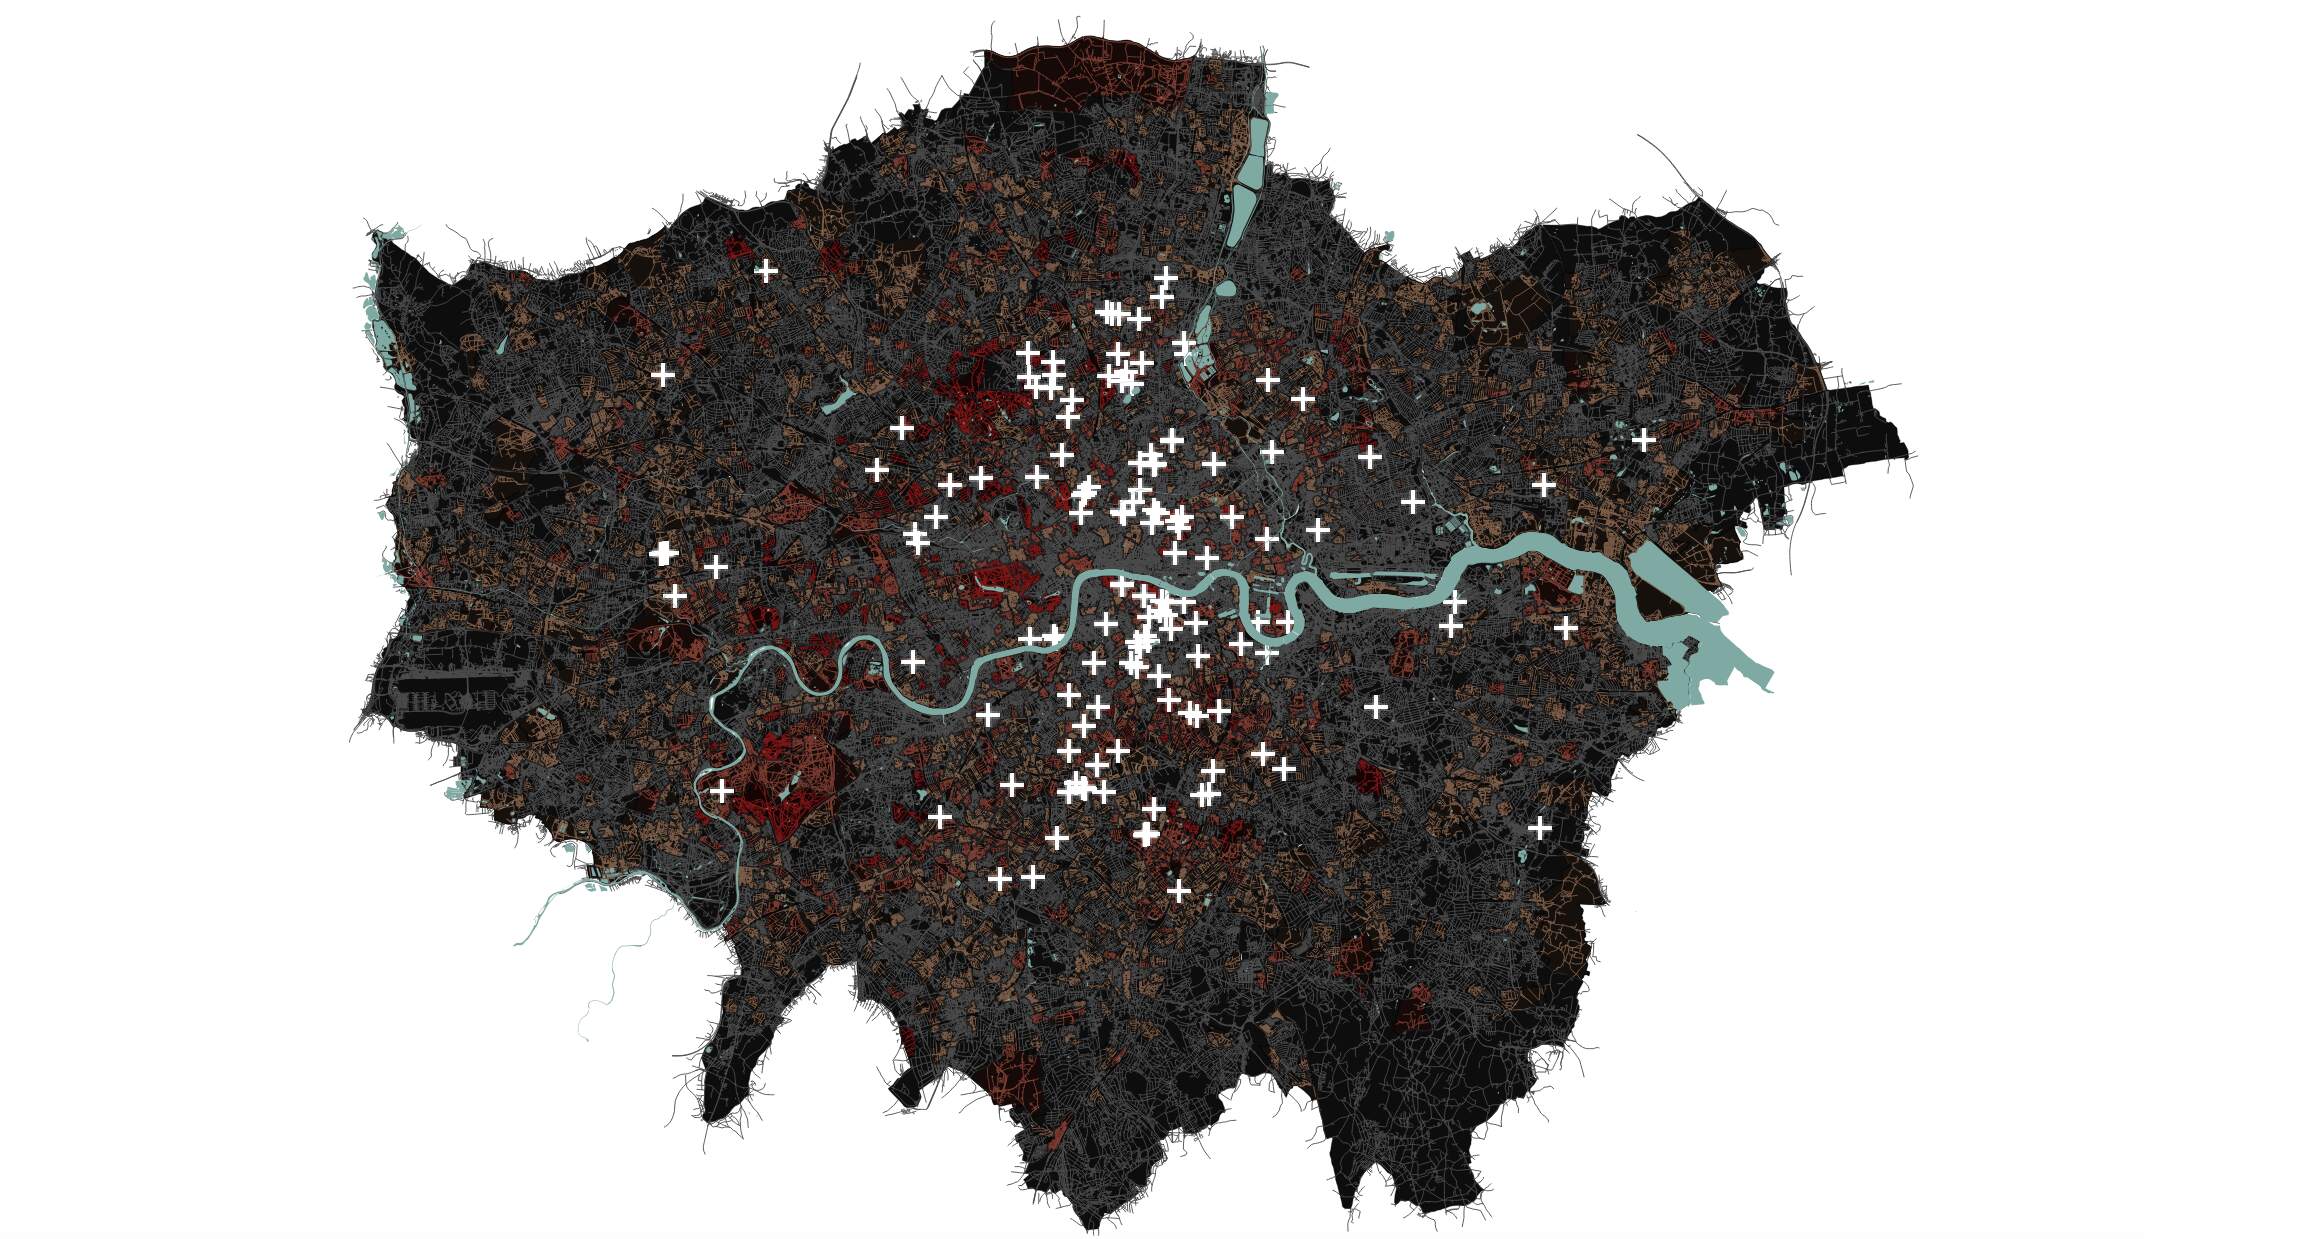
Damp map
Where possible, I have been inputting both survey responses and news coverage into a database map on QGIS. For survey responses this was done when full postcodes were supplied, and for news coverage where a exact location was either named in the article, or possible to work out by using in-text information and images to geolocate cases.
ONS data, for example on change in house prices, was then overlayed to help compare and contextualise high cluster areas.